QueryTune is the state of the art tool that quickly analyzes and suggests how to improve your query performance in case of any opportunity.
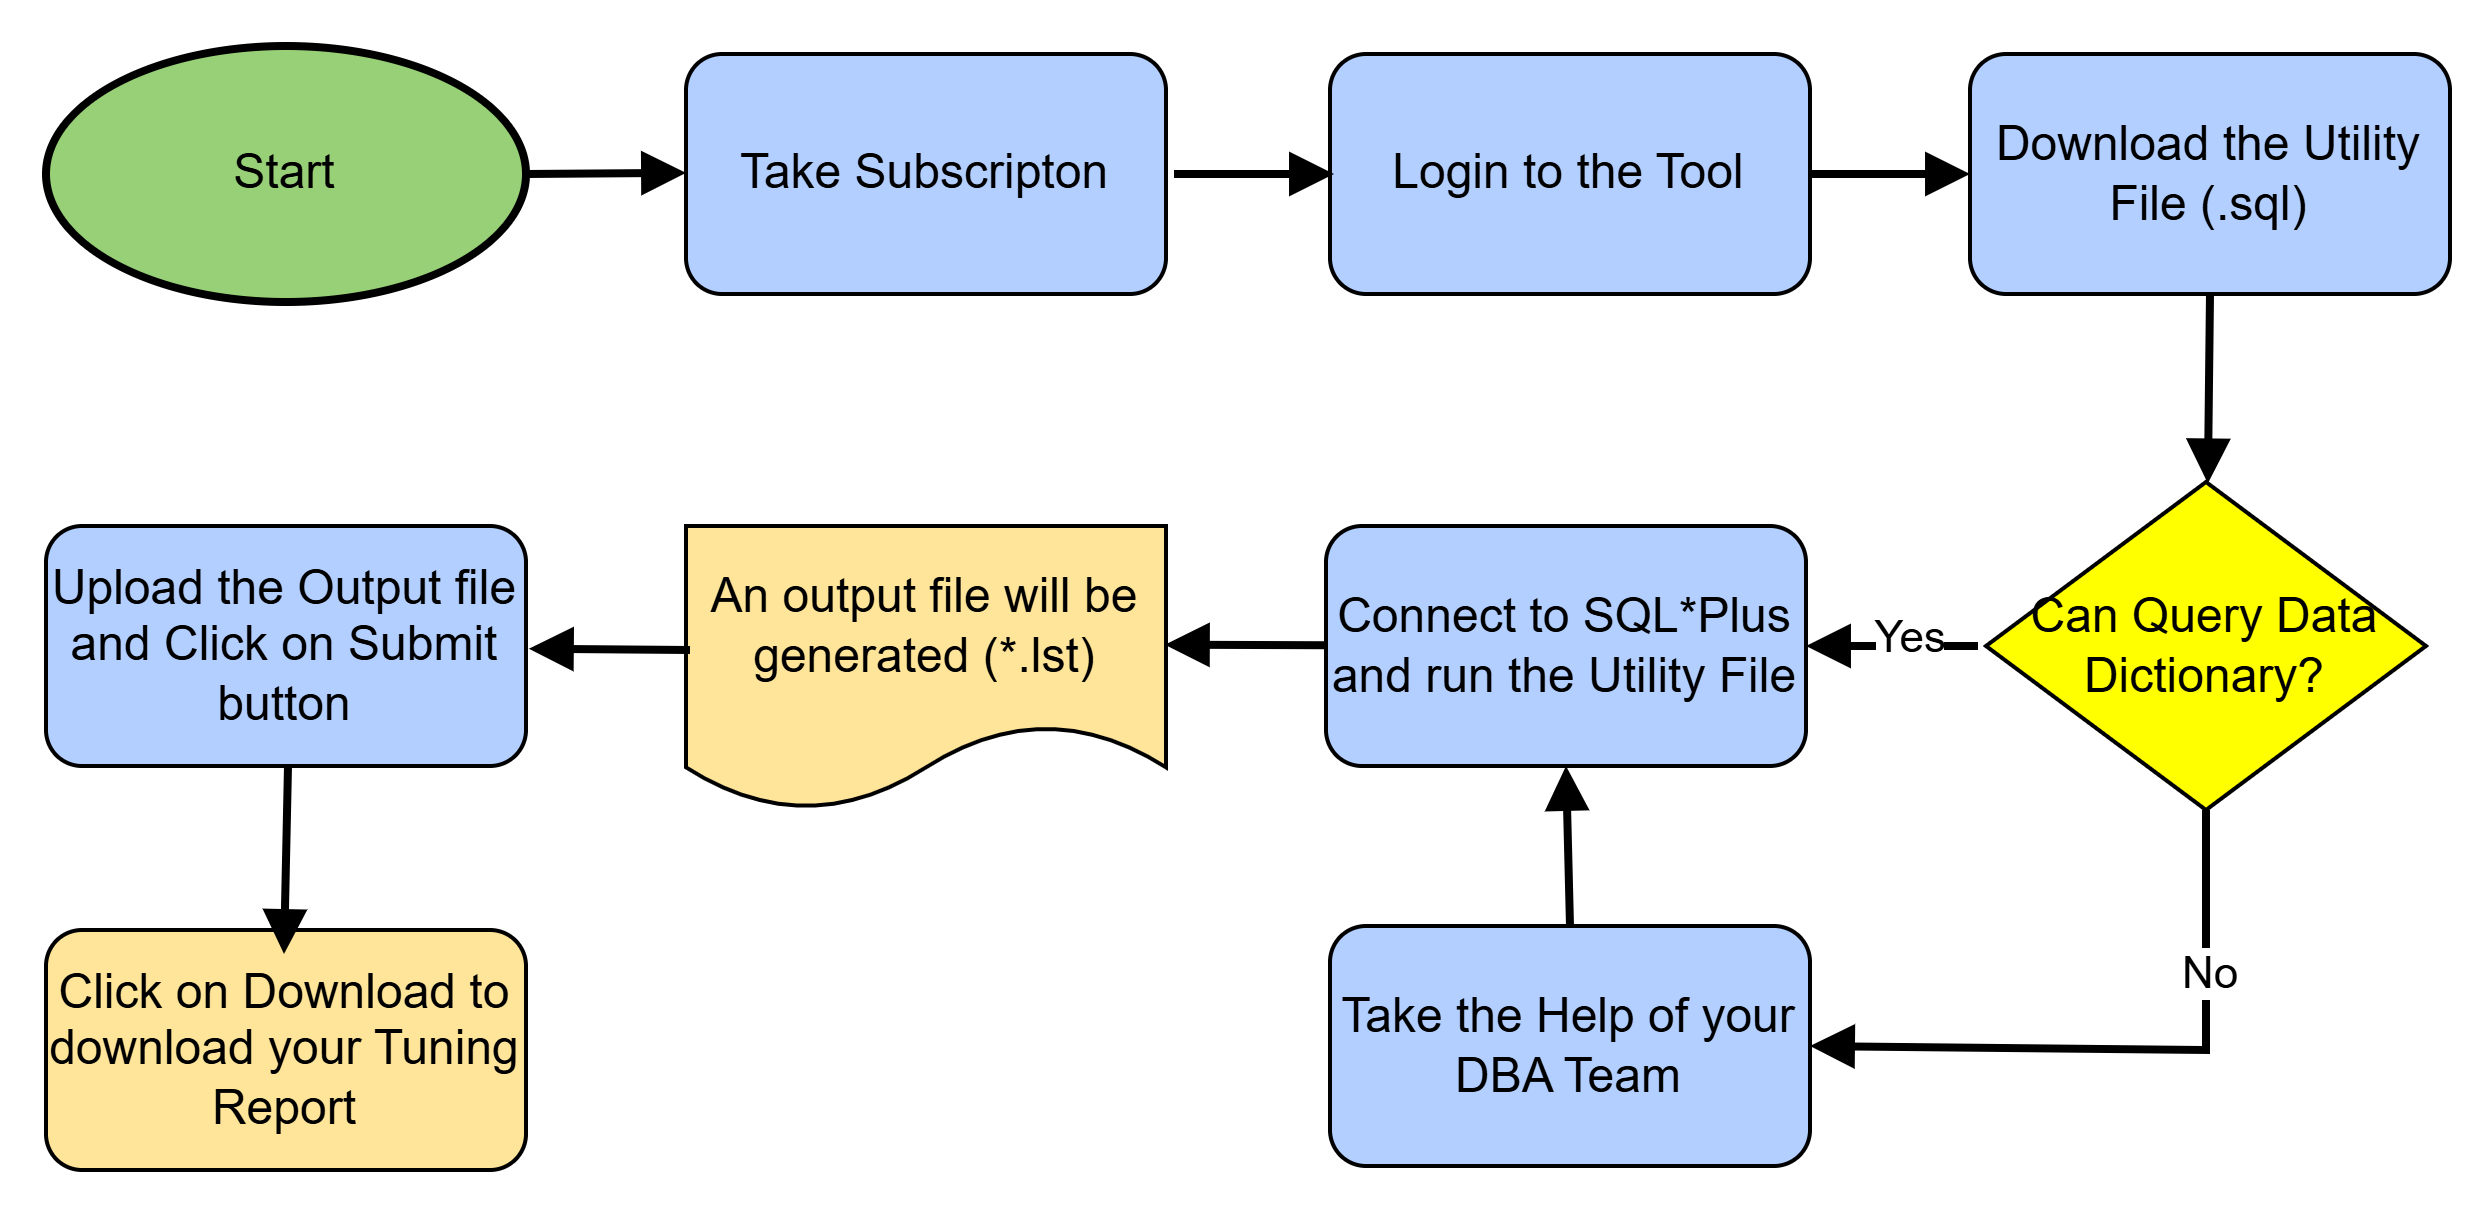
Please observe below flow chart
QueryTune is the state of the art tool that quickly analyzes and suggests how to improve your query performance in case of any opportunity.
Utility file contains several queries (SELECT statements) that will SELECT some key meta data required to understand the query execution and identify potential bottlenecks. Queries in Utility file read the Meta data pertaining to SQL_ID provided as input from the following data dictionary views:
Output file contains important information that can be referred for your analysis along with Analysis and Suggestions from our tool. Each sub-head has been explained in detail below:
This section of the report will display the SQL Text of the SQL_ID on which output file was generated.
This section of the report will display run time execution plan of the query. Due to any reason if the query is taking multiple plan in different Nodes of the RAC, It will display all the execution plans. lTable that display execution plan will have three columns and column described below.
| Column Name | Description |
|---|---|
| ID | Serial number of each row source operation |
| Row Source Operation | Display’s each operation such as Table access and/or Index Access |
| Object Name | Display’s Object Name that has been access at the respective row source operation |
Table in this section of the report will display tables that has been used in the given query and all its necessary statistical information. Each column has been described below.
| Column Name | Description |
|---|---|
| Owner | Schema name that owns the table object |
| Table Name | Name of the Table Object |
| Temporary | Displays ‘Y’ if the table is the Global Temporary Table else it displays ‘N’ |
| No. of Rows | Number of rows in the table at the time of last statistics gathered. |
| % Analyzed | Displays sample percent used when last gather statistics run on the table. |
| Last Analyzed | Date and Time when table last analyzed. |
| Total Blocks | Total Oracle blocks allocated to the table. |
| Blocks Used | Estimated number of blocks used based on average length of the record. |
| % Fragmentation | Fragmentation percent calculated based on Total and Used blocks. |
| Degree | Degree of parallelism currently associated with table object. |
| Stats Stale? | Displays ‘YES’ if the last gathered statistics are Stale else ‘NO’ |
This table contains list of indexes used by the query execution and respective statistics.
| Column Name | Description |
|---|---|
| Table Owner | Schema name that owns the table on which index got created |
| Table Name | Name of the Table Object |
| Index Owner | Schema name that owns Index Object |
| Index Name | Name of the Index Object |
| Column Name | Column Name on which the index created |
| Column Position | Columns position number in composite index (Index Created on Multiple columns) |
| Status | Stats of the Index (VALID, INVALID, DISABLED, Etc) |
| B-Level | B-Tree Level. This indicates depth of the index from its root block to its leaf block. |
| Leaf Blocks | Number of leaf blocks in the Index |
| No. of Rows | Number of rows in the index. If the index type is bitmap index, it indicates number of distinct keys. |
| %Analyzed | Percent Analyzed. This value calculated based on sample size used to analyzed the index against number of rows in the index. |
| Last Analyzed | Date last analyzed the index. |
| Uniqueness | Uniqueness of the index. This indicate whether index Unique or Non-Unique. |
| Degree | This value indicates Degree of Parallelism. |
This table contains list of all indexes those created on list of columns used in the query across all tables whether used by execution of the query or not.
| Column Name | Description |
|---|---|
| Owner | Schema name that owns the table object |
| Table Name | Name of the Table Object |
| Temporary | Displays ‘Y’ if the table is the Global Temporary Table else it displays ‘N’ |
| No. of Rows | Number of rows in the table at the time of last statistics gathered. |
| % Analyzed | Displays sample percent used when last gather statistics run on the table. |
| Last Analyzed | Date and Time when table last analyzed. |
| Total Blocks | Total Oracle blocks allocated to the table. |
| Blocks Used | Estimated number of blocks used based on average length of the record. |
| % Fragmentation | Fragmentation percent calculated based on Total and Used blocks. |
| Degree | Degree of parallelism currently associated with table object. |
| Stats Stale? | Displays ‘YES’ if the last gathered statistics are Stale else ‘NO’ |
This table contains list of columns has been present in the access predicates and filter predicates of the query along with their statistical information.
| Column Name | Description |
|---|---|
| Owner | Schema name that owns the table object |
| Table Name | Name of the Table Object |
| Column Name | Column that has been used in the query. |
| Data Type | Data Type the column. |
| Nullable | Is the column allows NULL or will not allow NULL values |
| No. of Nulls | Total number of NULL values out of total number of records in the table |
| No. Distinct | Number of distinct values across total number of records in the table. |
| Histogram | Type of Histogram collected on the respective column while analyzing the table. If the value is NONE there is no histogram collected. |
This section will provide you the analysis of the query and tuning suggestion provided the tool.
Analysis points that observed by the tool that can degrade the performance of the query.
Suggested actions to address the observations
*** Action plan contains in above section of the report are ONLY suggestion from the tool. User may need to validate in lower environments for the recording of performance improvements as an evidence before moving to the actual/production environment.
To measure the performance improvement after deploying the suggestions provided to tool, we suggest user to collect before and after TKPROF file. Below is the example of the TKPROF output file.
                    Before Suggestions
                    call     count  cpu     elapsed  disk      query     current  rows
                    -------  -----  ------- -------- --------- ---------- ------- -----
                    Parse        1     0.37     0.41         0          0       0     0
                    Execute      1     0.00     0.00         0          0       0     0
                    Fetch        1   325.83  1373.88   2113075   17236595       0     0
                    -------  -----  ------- -------- --------- ---------- ------- -----
                    total        3   326.20  1374.30   2113075   17236595       0     0
                    -------  -----  ------- -------- --------- ---------- ------- -----

                    Post deploying the suggestions
                    call     count  cpu     elapsed  disk      query     current  rows
                    -------  -----  ------- -------- --------- ---------- ------- -----
                    Parse        1     1.87     1.94         0          0       0     1
                    Execute      1     0.00     0.00         0          0       0     0
                    Fetch        1     1.73     2.69        10      32182       0     0
                    -------  -----  ------- -------- --------- ---------- ------- -----
                    total        3     3.61     4.63         10      32182      0     1
                    -------  -----  ------- -------- --------- ---------- ------- -----
A Product By